EurOPDX Data Portal
Main Functions of the EurOPDX Data Portal
In this section we would like to provide to users of the EurOPDX Data Portal a few examples of its function from the user’s perspective in terms of “How to…”.
After a registration or login you can open the Search part of the Data Portal.
1. Checking Availability of PDX Models according to diagnosis
There are filters available on the left side enabling you the search of the PDX models according to your interest. 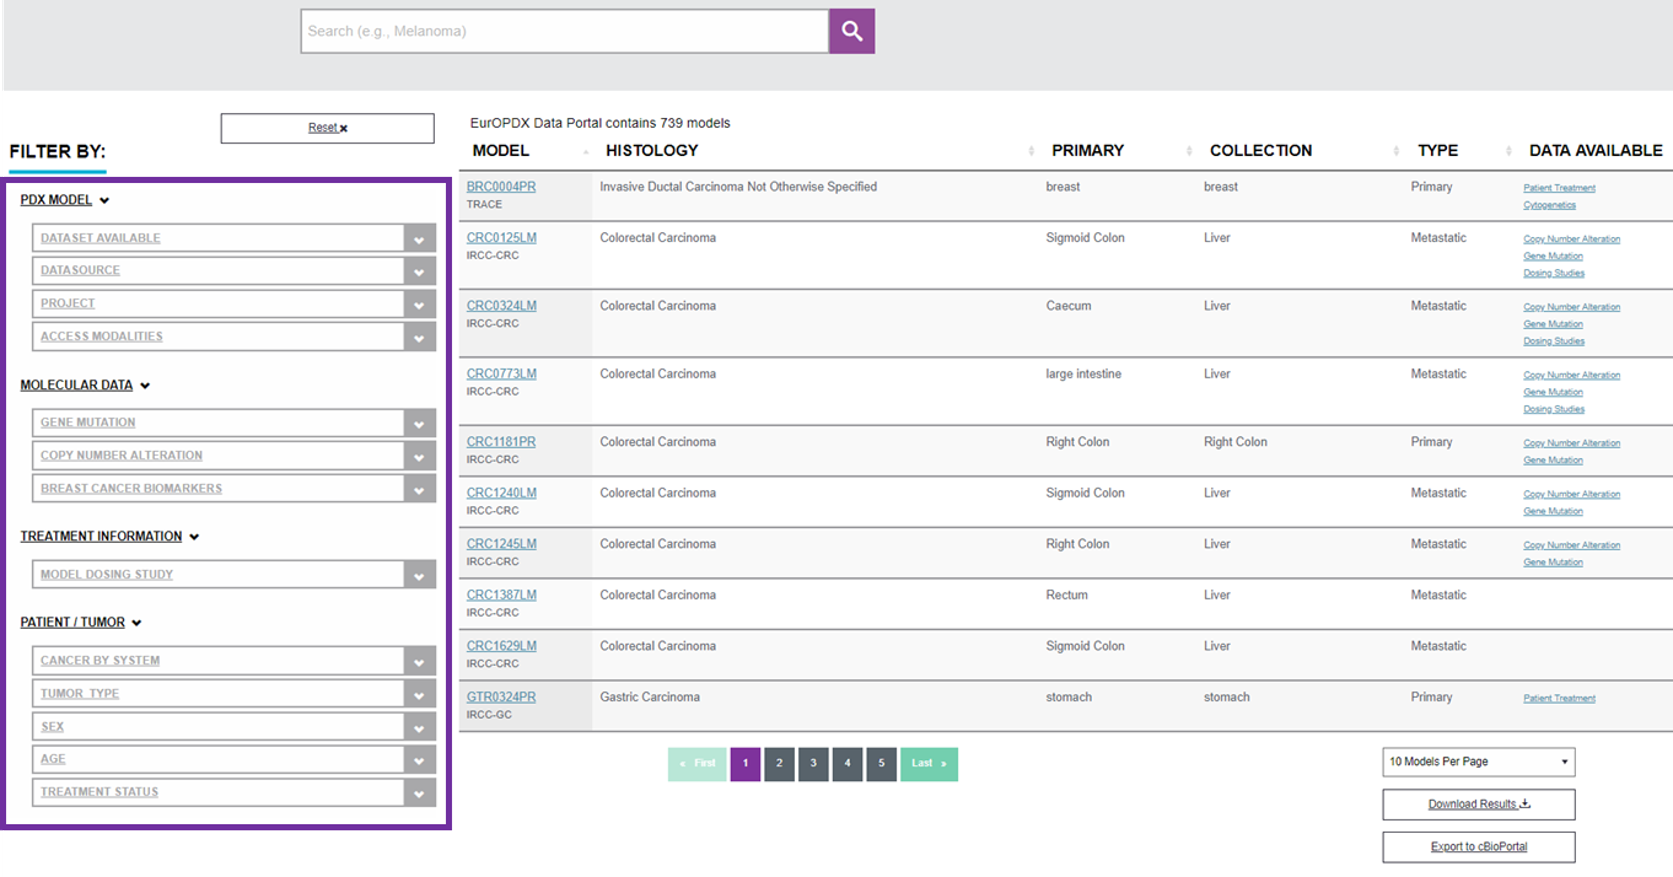
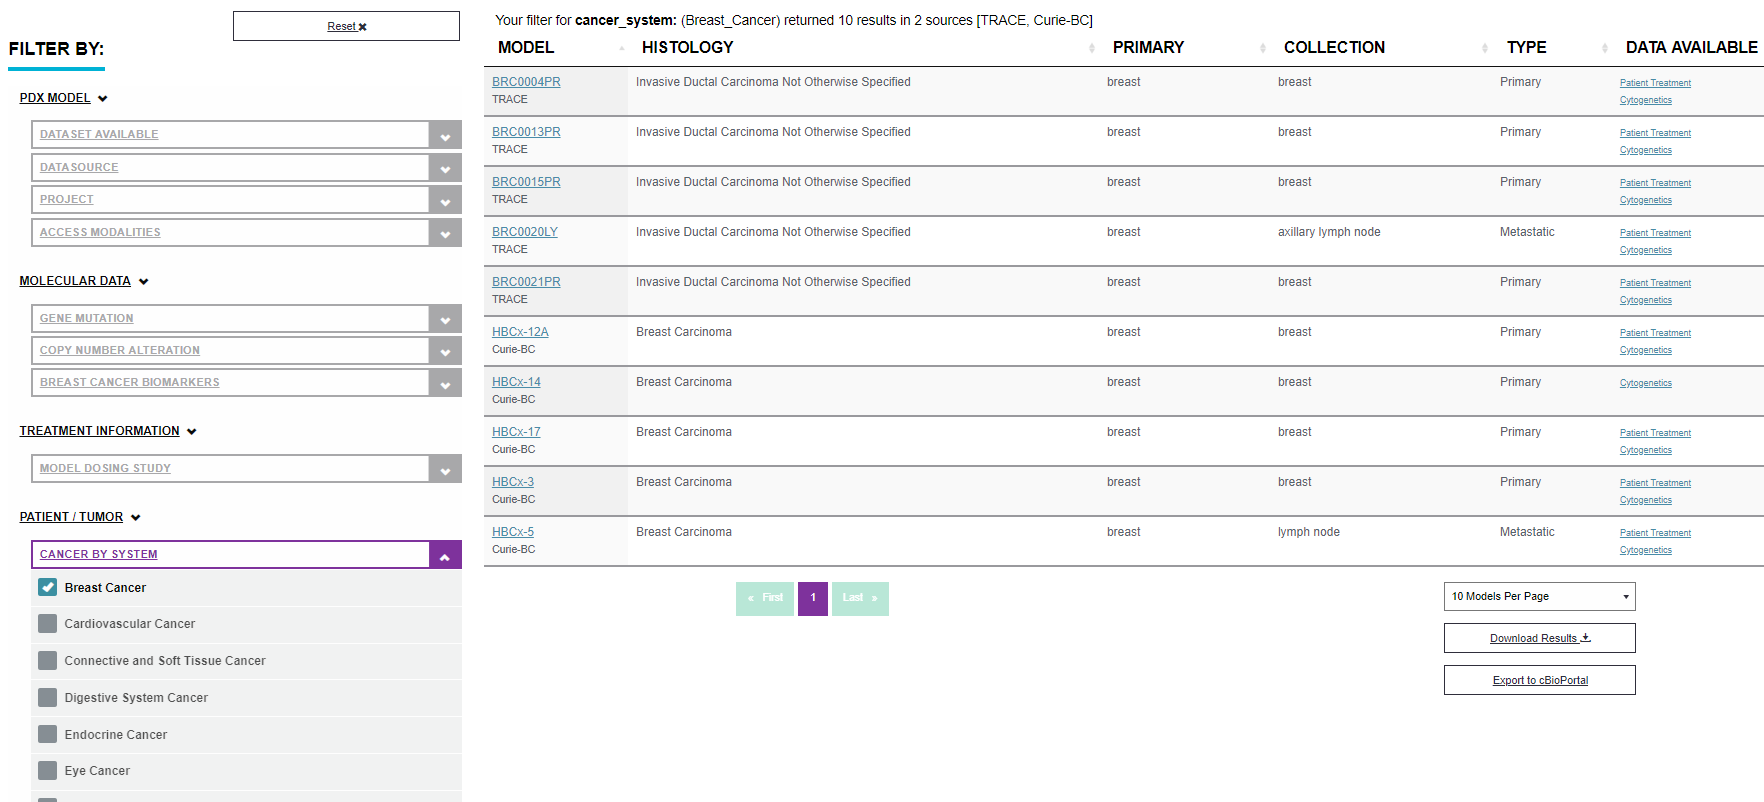
The easiest way of using the filter is one parameter selection. Some users can prefer to look for PDX models with a specific diagnosis for example. In this case choose an option in the filter “CANCER BY SYSTEM” in a patient/tumor attributes part. The Data Portal lists the PDX models with intended attributes immediately. For example when the breast cancer filter is chosen it will end up with 10 results from 2 research centres. See the image below.
It is possible to combine filters any way. More examples follow.
Filtering according to given model ID
It is possible to enter a concrete model ID into DataPortal’s search box - this will set the filter just to this one model.
2. Specific Molecular Characterization of PDX Models and Vizualisation of available data
Here is shown a very specific case of PDX models selection according to a molecular characterization based on individual gene mutation and/or copy number alteration.
Since molecular data is not available for all PDX models in EurOPDX Data Portal it is useful to filter by “DATASET AVAILABLE” first. Filter for genes of interest can follow.
Result is Your filter for data_available: (Copy_Number_Alteration, Gene_Mutation), mutation: (KEAP1___ALL), copy_number_alteration: (TP53) returned 2 results in 1 source [Curie-LC] 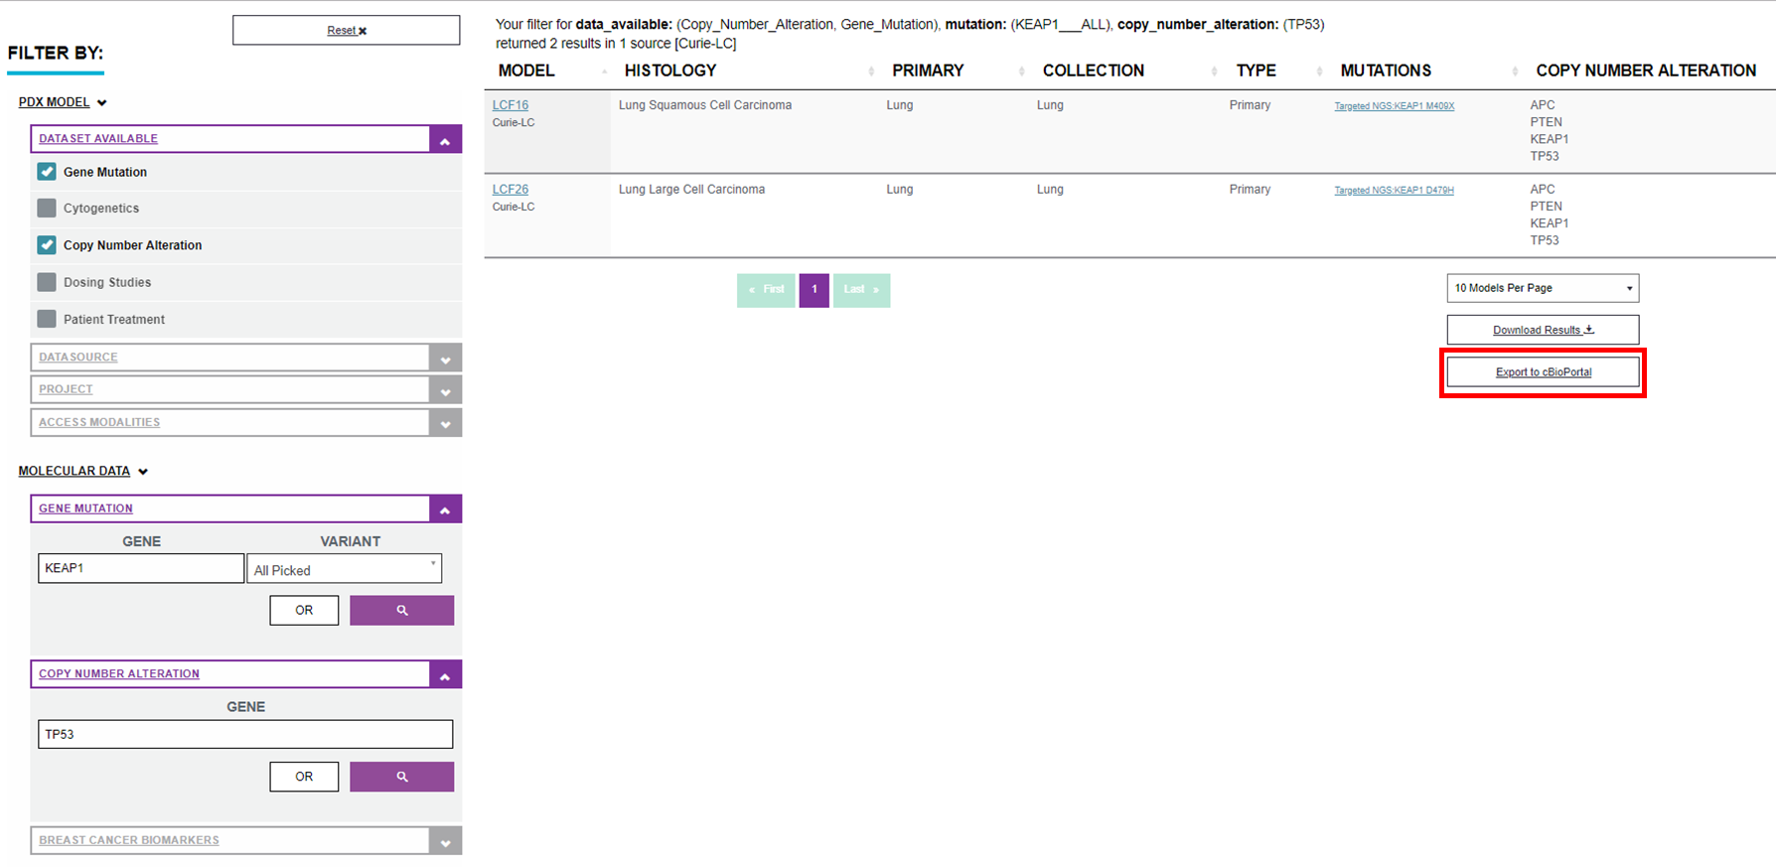
This data set can be visualize in EurOPDX cBioPortal enabling you further data analysis and advanced PDX models identification. For data transfer to cBioPortal click on “Export to cBioPortal” button highlighted in red at the picture above.
cBioPortal features will be better described bellow in the next example.
3. Identification of PDX models within one complex collection/study using EurOPDX cBioPortal
Within the cBioPortal are samples divided into studies according to one diagnosis. It is a big advantage of the cBioPortal that enables gene specific browsing of more studies together,comparison of different data types and/or different diagnosis at one moment. In this case is shown a simple data analysis on complex data in cBioPortal (mutation, CNA, expression data). How to get cBioPortal on-demand with EurOPDX data of interest is described above.
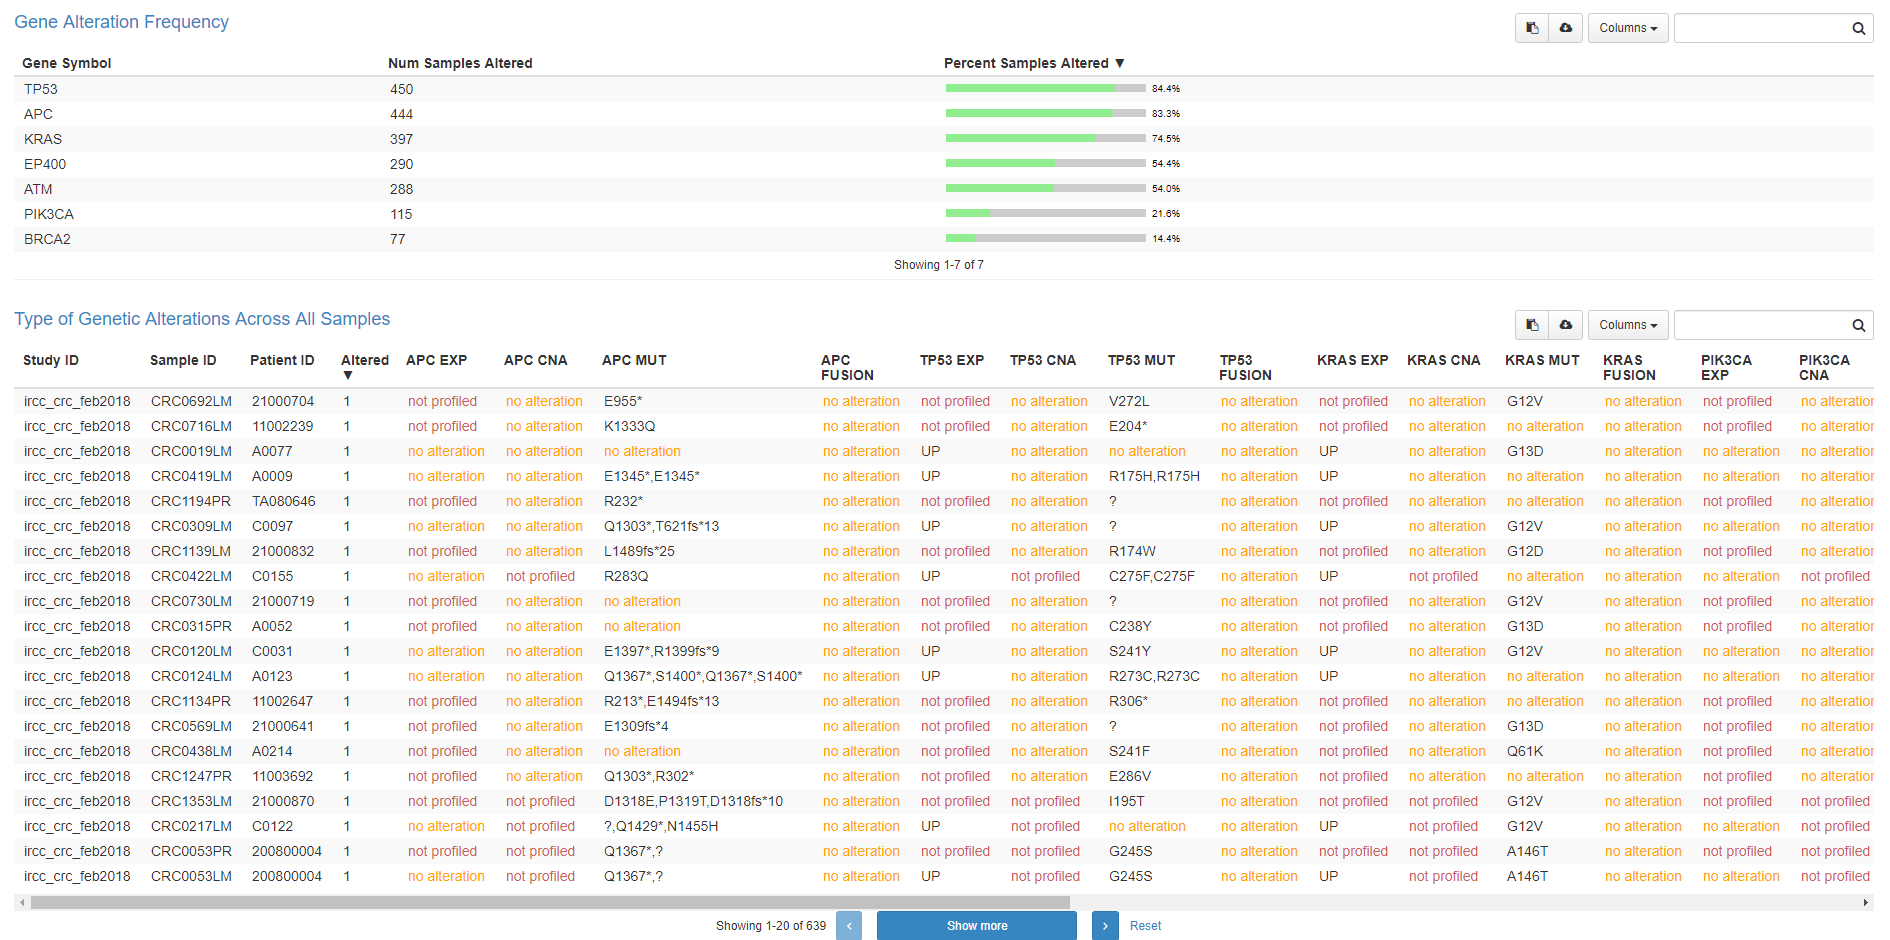
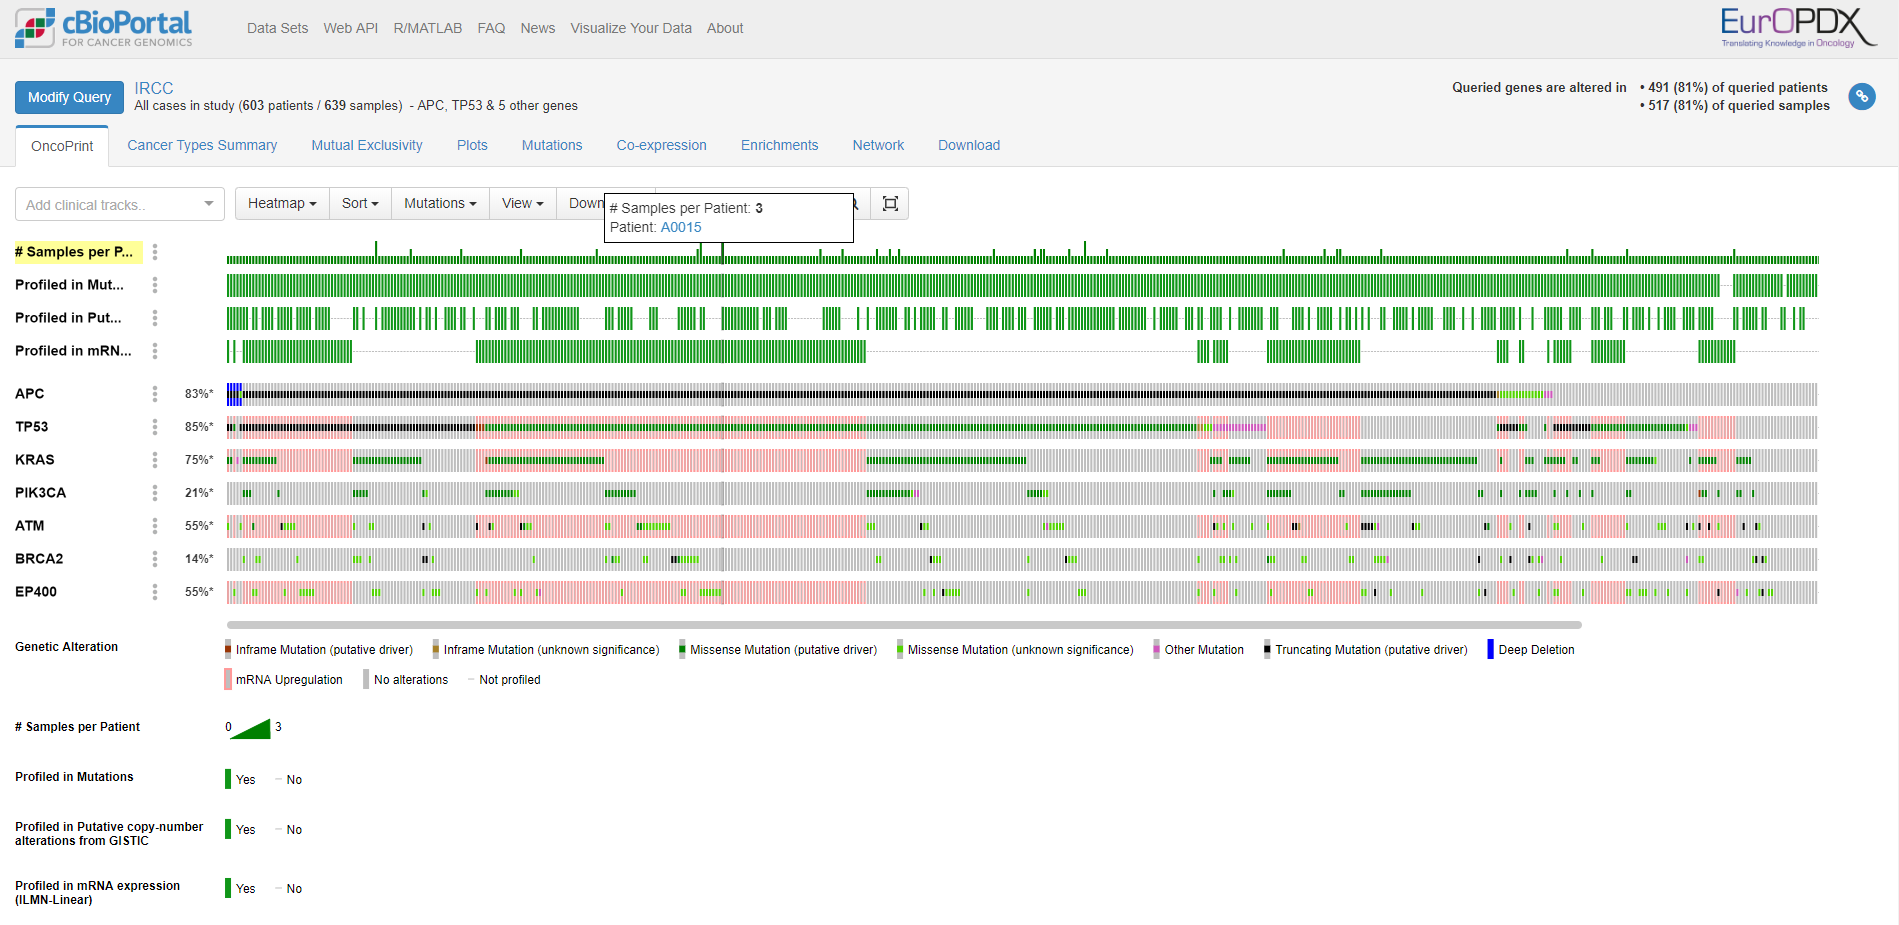
The biggest collection of PDX models (639) we have now in EurOPDX Data Portal is from IRCC data source with colorectal carcinoma diagnosis (IRCC-CRC). More EurOPDX collections is available via the Data Portal or publicly available on EurOPDX cBioPortal instance.
- You, first, filter the data according to “DATA SOURCE”.
- Second, “Export to cBioPortal” all data available for the study.
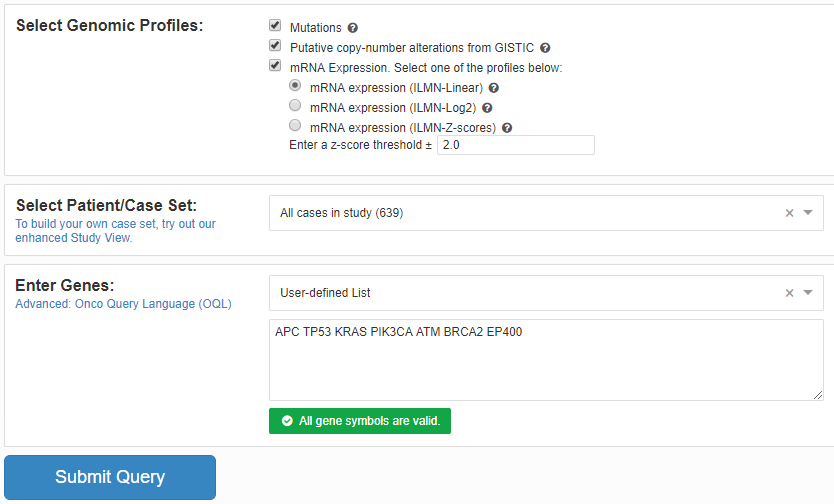
- When the button “Creating instance…” is changed to green “cBioPortal”, you can start using the specific instance containing only data you filtered. See the picture bellow to try suggested set up of the query. I recomend you to go through this tutorial with your own instance of cBioPortal ready to use.
The first screen you see when submit the query is Oncoprint. There is information about molecular data available for each PDX model and overview of genetic alterations.
Note: Originaly is cBioPortal for cancer genomics designed for humans so that there are Patients and Samples used instead of PDX model and Sample. We are working on optimization of this attitude to lower this confusing nomenclature.
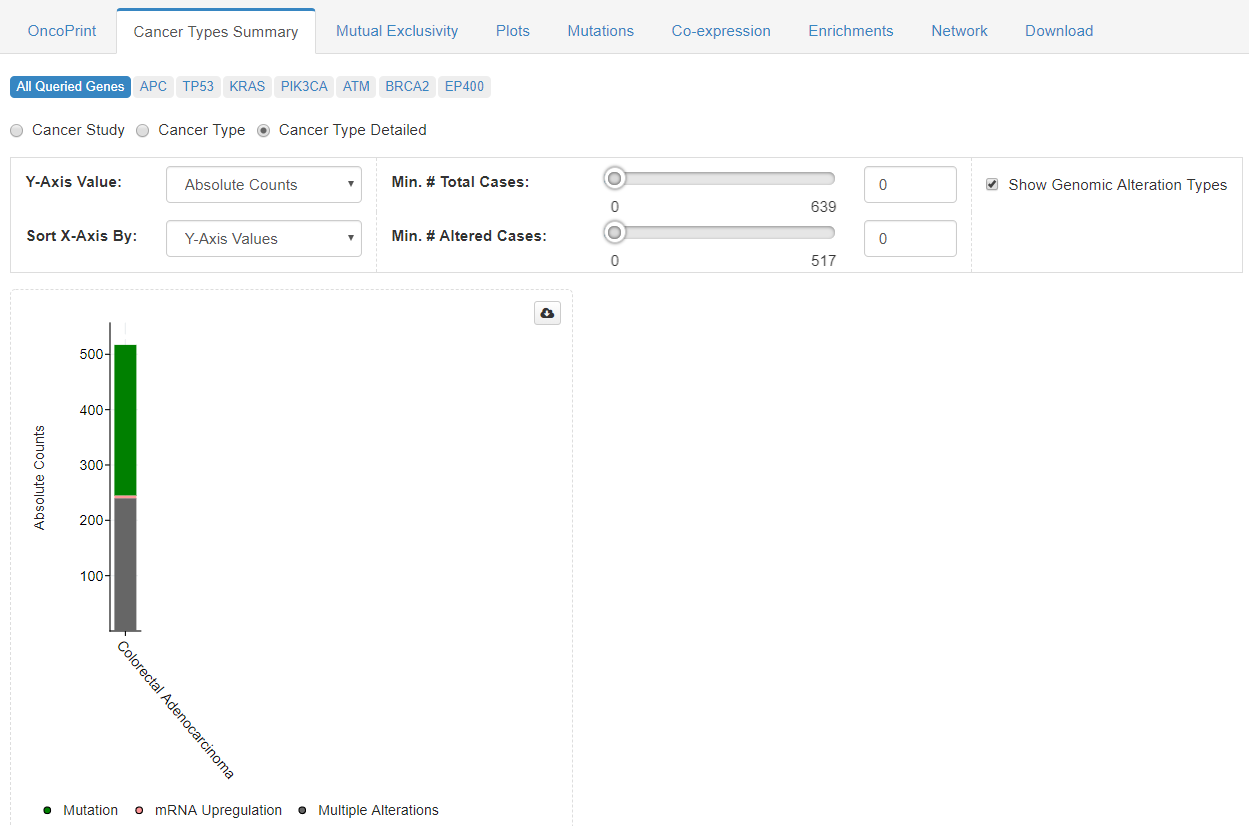
Second window offer an summary of genetic alterations and cancer types present in the whole dataset.
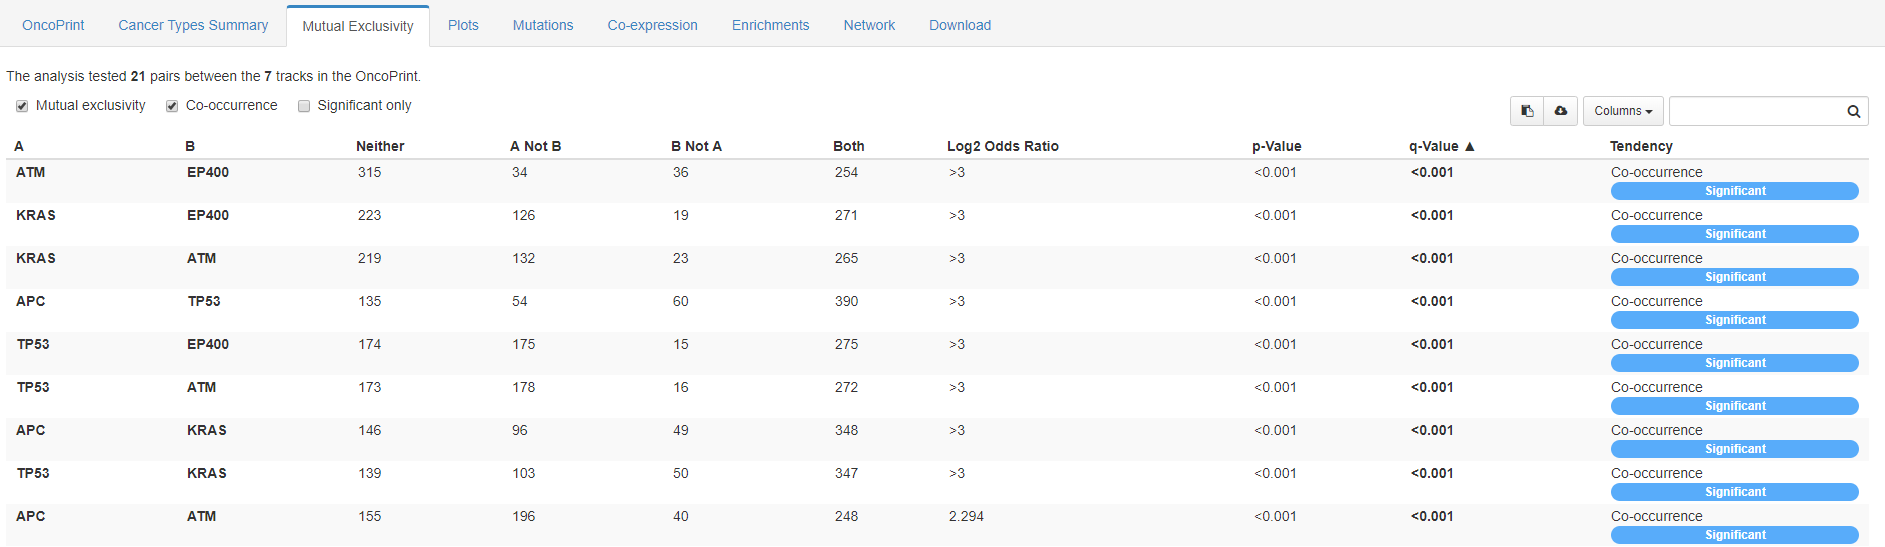
In the third tab is available a mutual exclusivity of genes of interest viewed in a synoptical table.
Following screenshots are showing data analysis in the forth tab called Plots. You can compare different data types and genes by plotting them into graphs.
-
Mutation count vs. age at collection

-
Mutation count vs. mutations present in chosen gene (ATM)

-
mRNA expression of a specific gene (TP53) vs. mutations of the same gene (TP53)

-
mRNA expression of a specific gene (TP53) vs. mutations of another gene (ATM)

Fifth data analysis possible in cBioPortal platform is focused on Mutatios. There is graphical visualization of gene domains and appropriate mutations present in the data set available for each gene of interest. Below the gene picture is a table with listed protein changes afected by the mutation present in each sample. Detailed anotations and 3D structure are available for each gene of interest as well. 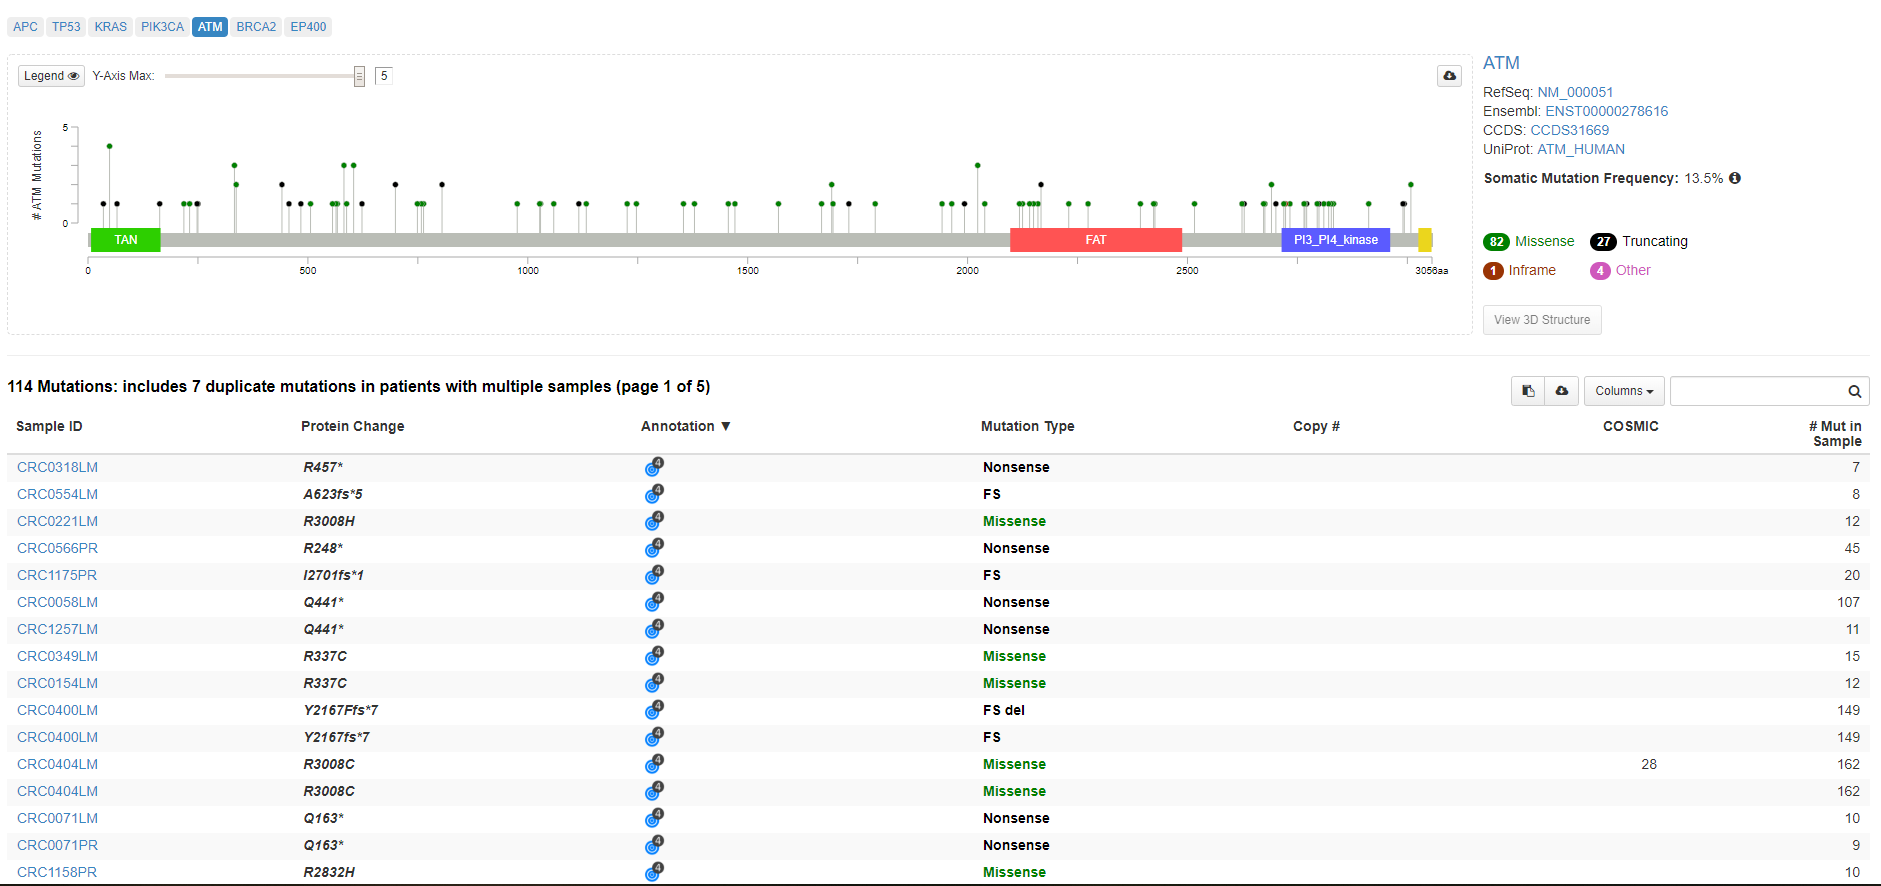
Sixth window is focused on gene correlation across microaray samples and Co-expression of approppriate genes in available samples. 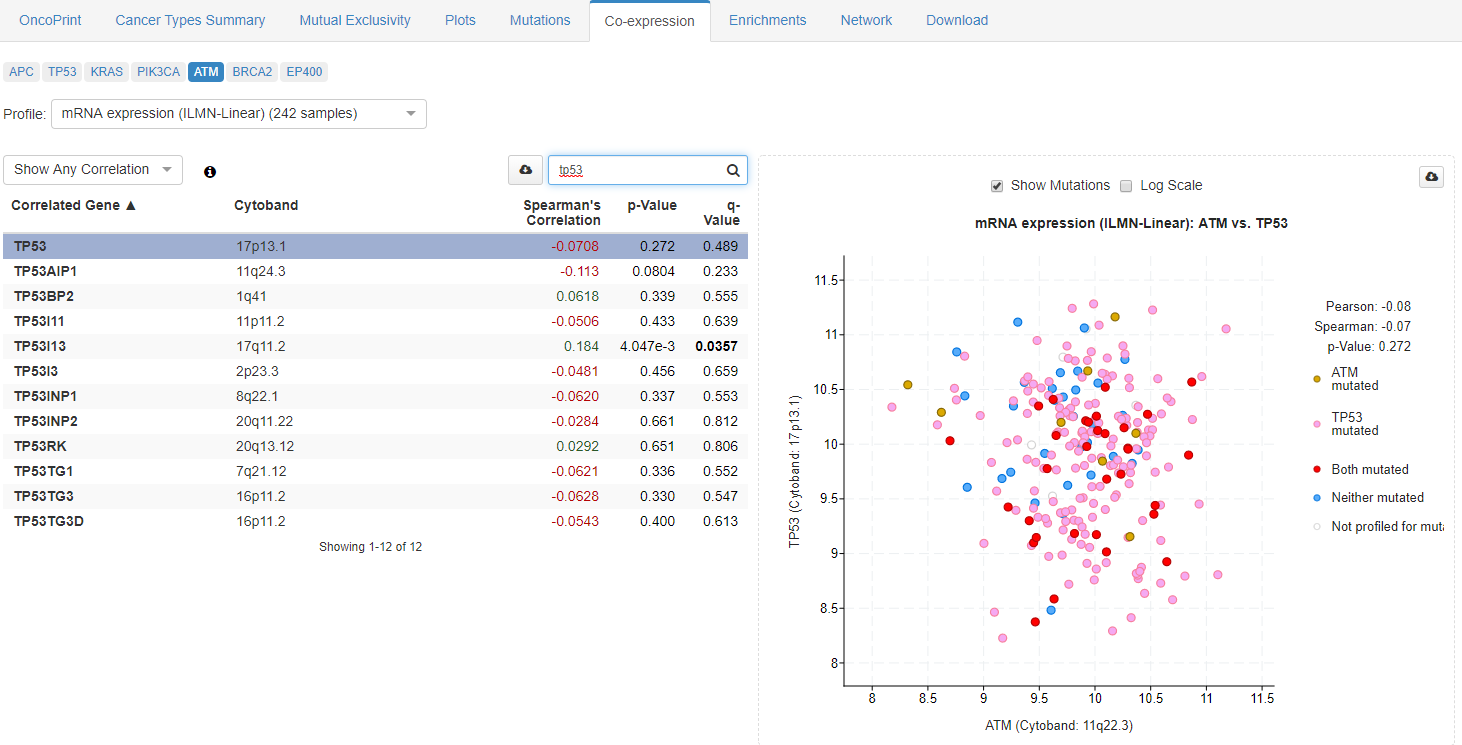
Next to the mutual exclusivity it is possible to analyze a co-occurrence of the genes of interest with other genes in the window called Enrichments. It works for available data types within each data set. 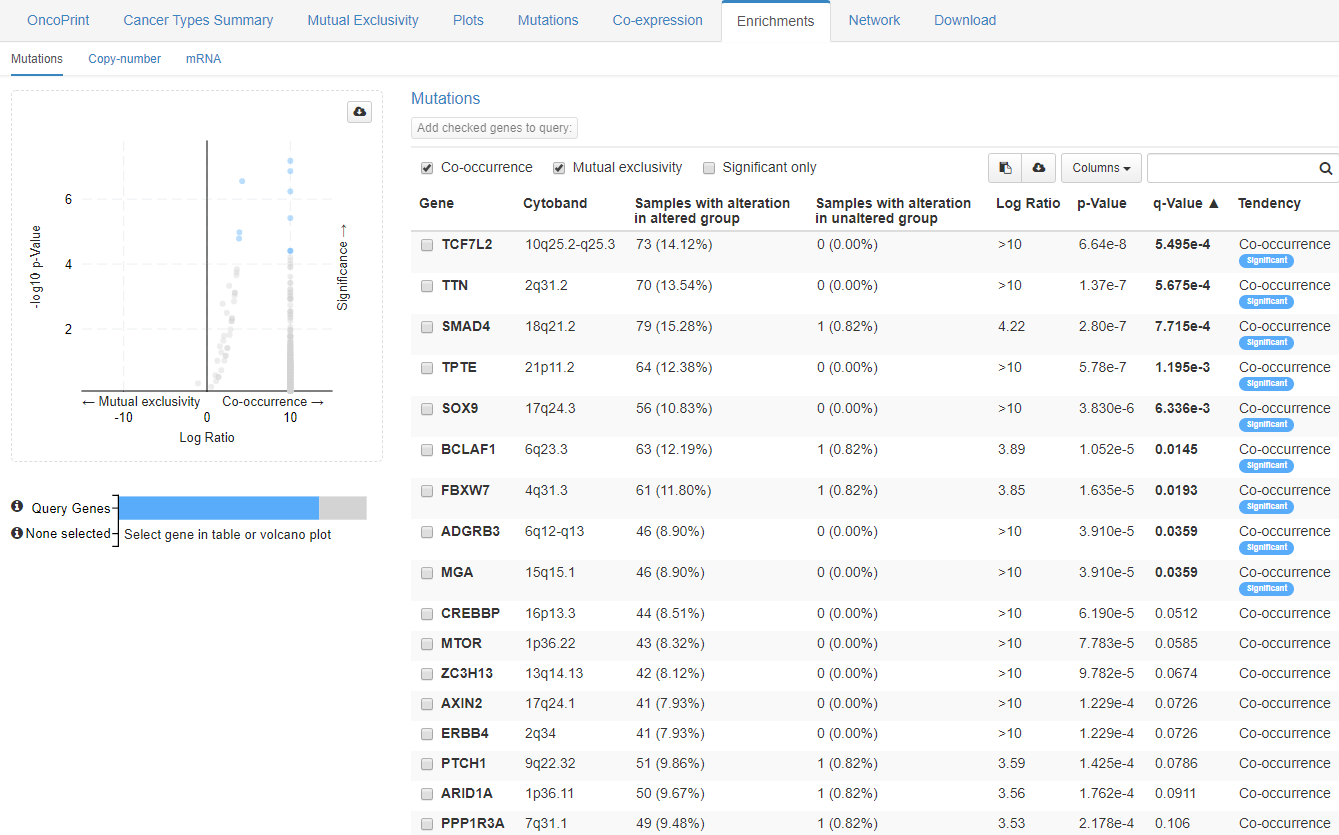
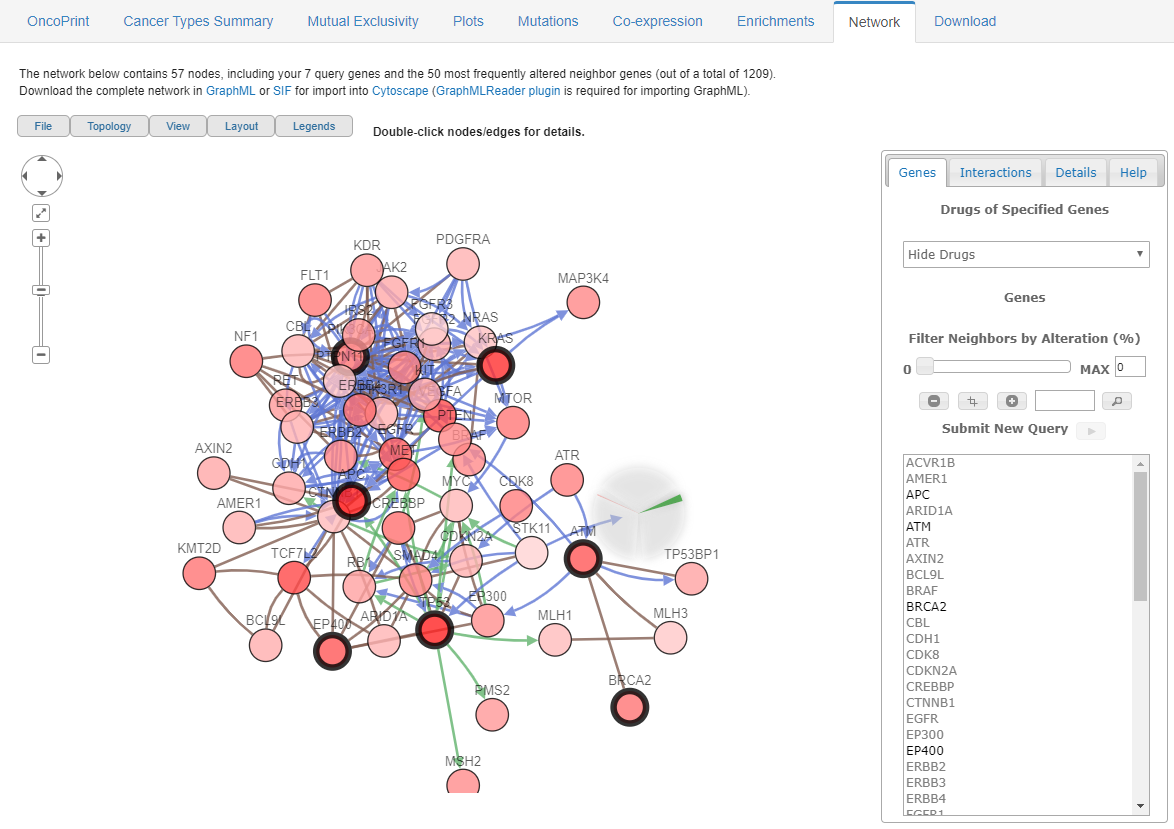
Interactions and relationships are shown in eight window with Network. The network contains appropriate number of nodes (genes), including the query genes and their 50 most frequently altered neighbor genes. The features visualized by the Network can be customized according to your needs.
Ninth window enables users to download the data sets and shows another well arranged table with genetic alteration types across all samples.